Usage & analytics
The Usage page — _'Spend & activity across your API resources'_ — shows how much you're spending, on what, and how it's trending.
The Usage page — "Spend & activity across your API resources" — shows how much you're spending, on what, and how it's trending.
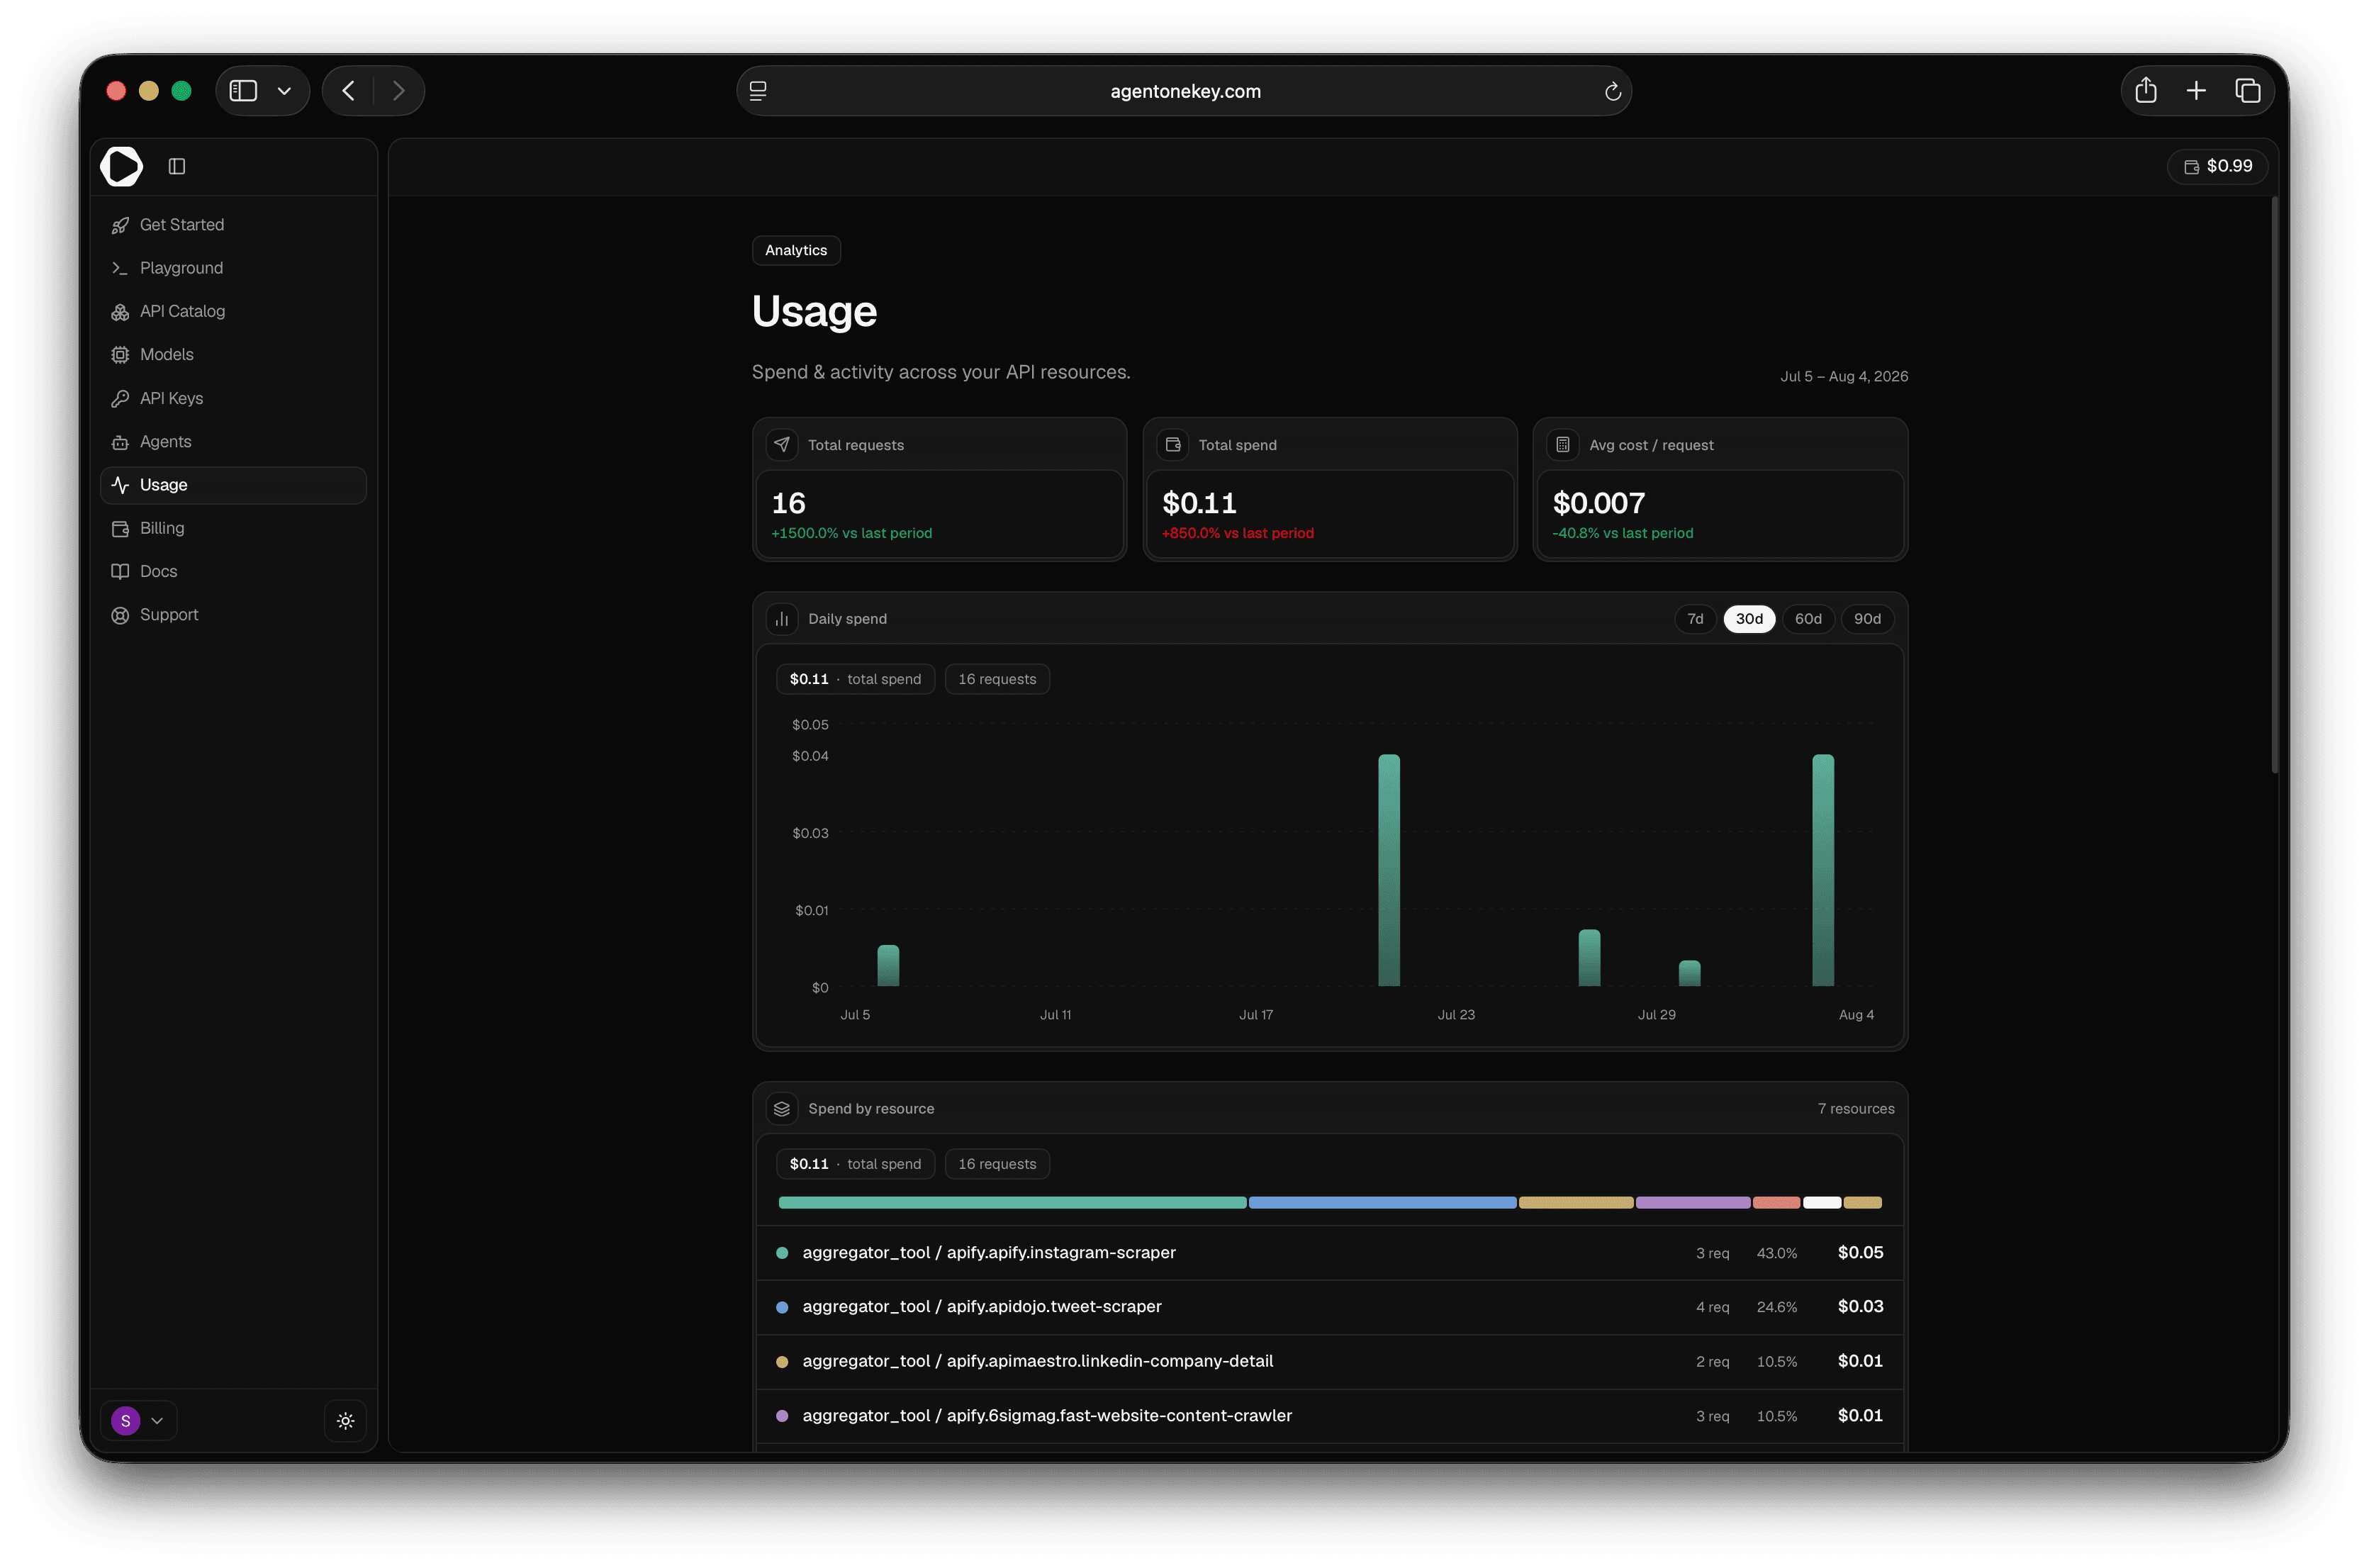
Pick a period
Four range pills — 7d, 30d, 60d, 90d (default 30d) — sit on the Daily spend card and drive the whole view. The date range is shown top-right (e.g. "Jul 1 – Jul 30, 2026"). Data refreshes automatically about once a minute.
The stat cards
Three cards, each with a "% vs last period" delta:
| Card | Shows |
|---|---|
| Total requests | Number of API calls (up = green) |
| Total spend | Dollars spent (down = green) |
| Avg cost / request | Average per call (down = green) |
Charts & breakdowns
- Daily spend — a bar chart of spend per day across the period, with total spend and request count above it. Hover a bar for that day's spend, requests, and avg/request.
- Spend by resource — spend grouped per resource (or
resource / sku), sorted highest first, each with its request count and share of total.
Spend history
An itemized table under Spend history with columns Date · Resource · Key · Amount. Select Load more to page through older entries (20 at a time).
Use the Key column to see which API key drove each charge — a reason to give each agent its own key.
Empty state
Before your first call: "No spend in this period — Usage will appear here once API requests are made."
Next steps
- Read your transaction history — the raw ledger
- Understand your balance
- Set per-key spend caps